How Andor iXon EMCCD Cameras Present Data

- Quantify data in electrons or incident photons
- Convenient estimate of sample signal intensity at the detector
- Real time or post-convert
- Reference between different samples, users and set-ups
- Meaningful signal relating to PALM/STORM localization accuracy
One of the distinctive features of the iXon family is the capability to quantitatively capture and present data in units of electrons or photons, the conversion applied either in real time or as a post-conversion step.
Photons that are incident on pixels of an array detector are captured and converted to electrons. During a given exposure time, the signal in electrons that is collected in each pixel is proportional to the signal intensity. In EMCCDs, the signal in electrons is further multiplied in the EM gain register. The average multiplication factor is selected in software from the RealGain™ scale.
It can be desirable to directly quantify signal intensity either in terms of electrons per pixel or in terms of incident photons per pixel. However, during the readout process, array detectors must first convert the signal in electrons (the multiplied signal in the case of EMCCDs) into a voltage, which is then digitized by an Analogue to Digital Converter (ADC). Each Analogue to Digital Unit (ADU) is presented as a 'count' in the signal intensity scale, each count corresponding to an exact number of electrons. Furthermore, the signal value in counts will sit on top of an electronic bias offset value. In the iXon this 'baseline' is clamped at 100 counts.
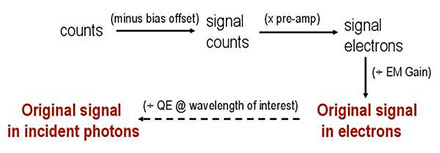
Therefore, in order to back calculate to the original signal in electrons, the electron to ADU conversion factor must be very accurately stored by the camera (which varies depending on the pre-amplifier gain selection chosen through software). Calculation of the signal as absolute electrons also requires knowledge of the bias offset and the EM gain. The calculation path is shown in Fig 1 (right).
Furthermore, knowledge of the Quantum Efficiency (QE) at each wavelength and light throughput properties of the camera window enables this process to be taken a step further, allowing the signal to be estimated in photons incident at each pixel. For this step, the user must input the signal wavelength. In fluorescence microscopy for example, this would correspond to the central wavelength defined by a narrow band emission filter matched to the fluorophore of interest. If the spectral coverage of the signal on the detector is too broad, such that the QE curve varies significantly throughout this range, then the accuracy of the incident photon estimation would be compromised.
The Count Convert functionality of the iXon provides the flexibility to acquire data in either electrons or incident photons, with negligible slow down in display rate. Furthermore, the option exists to record the original data in counts and perform this important conversion to either electrons or photons as a post-conversion step, while retaining the original data.


